


-
×
 Dragino LT22222-L I/O Controller
3 × AU$49
Dragino LT22222-L I/O Controller
3 × AU$49 -
×
 Dragino Temperature Probe - Standard
1 × AU$3
Dragino Temperature Probe - Standard
1 × AU$3 -
×
 Dragino Distance Detection Sensor
1 × AU$69
Dragino Distance Detection Sensor
1 × AU$69 -
×
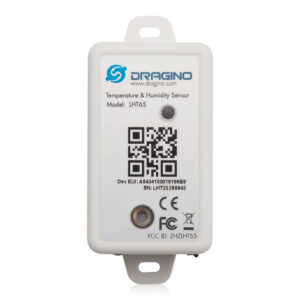 Dragino Temperature/Humidity Sensor
1 × AU$46
Dragino Temperature/Humidity Sensor
1 × AU$46
Subtotal: AU$265